KG-Chart for Cross Stitch User's ManualHow to use the KG-Chart |
As I'm not a native English speaker, this document probably has many strange English sentences. So, Please use a comment form to correct any English mistakes etc.
Thank you - Keiji
Thank you - Keiji
Cursor Information
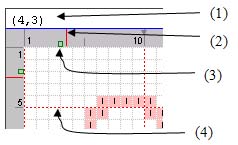
The information shown in the drawing area is as follows:

(1) Cursor coordinate (X, Y)
(2) Cursor location
(3) Support line box: Click this to draw the support line. Click it again to clear it.
(4) Sub grid lines. It is shown every five lines. The origin is the center of the chart.

(5) Selection's width and height (W,H)
(6) Selection's coordinates: Start-End
Standard

(1) Cursor coordinate (X, Y)
(2) Cursor location
(3) Support line box: Click this to draw the support line. Click it again to clear it.
(4) Sub grid lines. It is shown every five lines. The origin is the center of the chart.
When selection area exists

(5) Selection's width and height (W,H)
(6) Selection's coordinates: Start-End
Threads/Comments closed.
Contents List [-] - A Cover Page
- Preface
- Acknowledgement
- Main Functionality
- System Requirement
- Screens
- Main Screens
- A Drawing Toolbar
- Other Stitches Drawing Toolbar
- Palette
- Selected Color List
- File/View Toolbar
- Menu Bar
- Creating and saving a chart
- Creaing a new chart
- Loading a saved chart
- Saving a chart
- Converting an image to a chart
- Saving a chart in a standard image format
- Chose a Background Color
- Chart Information - View & Edit
- Confirming the number of colors
- Resizing
- Editing Cross Stitch
- Basic Drawing Tools
- Drawing Special Stitches
- Basic Drawing Tools (2)
- Selection
- Changing a color and a mark
- Editing Other Stitches
- Drawing Back Stitches / Other Stitches
- Selecting Other Stitches
- Changing the color
- Checking the color
- Chaning the line style
- Adding comments to the chart
- Drawing Support Tools
- Cursor Information
- Support Lines
- Resizing Drawing Area and Palette Area
- Realview to check finished image
- Print Preview and setup
- Print contents
- An arrangement of a chart and a color table
- Automatic Divided Printing
- Options
- About the Author
- Search
Recent Comments [-] - A Cover PageHow can I create a h
- A Cover PageHi, I'm using KG-Cha
- Editing Other StitchesHi, Great program!
- File/View ToolbarHi Donna, Select a
- File/View ToolbarHow do I use the rot
- Saving a chart in a standard image formatIs there any way to
- Creaing a new chartThanks Joseph! I've
- Creaing a new chartI think "For cross s
- Saving a chart in a standard image formatWhat is the solution
- Saving a chart in a standard image formatI have a suggestion
- 1171
 Bottom